
*
Threat of landslides shown in new map
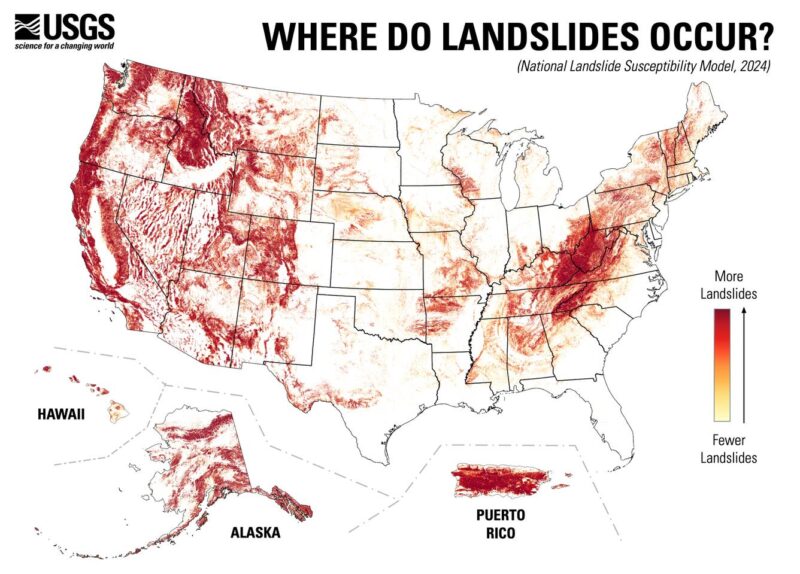
Some 85 million people go to sleep at night in areas prone to landslides. And 75 million Americans spend their days in landslide-prone areas. That’s according to a new study the U.S. Geological Survey released on September 11, 2024. California has the greatest number of people at risk. But West Virginia and Puerto Rico have the highest proportion of people at risk. Not surprisingly, the highest threat of landslides is in mountainous terrain, but nearly 44% of the U.S. could potentially experience landslide activity. As the press release said:
… there is also considerable potential scattered throughout other areas of the country.
The researchers published their study on September 11, 2024, in the peer-reviewed journal AGU Advances.
Mapping the threat of landslides
Previous maps only showed areas that had the highest threat of landslides. The new map extends the range to other areas also at risk. In fact, the map has a county-by-county assessment of landslide dangers. This level of detail is useful for urban planners, engineers, emergency managers, homeowners and more. Click here to take a deeper look at the threats in the United States.
Lead author Ben Mirus, a USGS research geologist, said:
This new national landslide susceptibility map addresses an important but difficult question: which areas across the entire U.S. are prone to landslides? We are excited that it is now publicly available to help everyone be more prepared to be a more hazard-ready nation.
How they created the map
The press release said the team:
… used an inventory of nearly 1 million previous landslides, high-resolution national elevation data from the USGS 3D Elevation Program, and advanced computing to build their comprehensive landslide susceptibility model.
Earlier maps had less detail and neglected landscape that was more moderately sloping. But the report said this is where most development and infrastructure are located.
The team used higher-resolution data, resulting in a map that shows details down to 90 meters, as compared to the previous detail of 1 kilometer. The red areas are most susceptible to landslide, with yellow less so, and white considered with negligible risk.
What exactly are landslides?
The USGS says:
A landslide is defined as the movement of a mass of rock, debris, or earth down a slope.
The term landslide includes five different types of movement: falls, topples, slides, spreads and flows. These would include things such as rockfalls and mudslides.
Landslides are usually the result of multiple causes:
Landslides can be initiated in slopes already on the verge of movement by rainfall, snowmelt, changes in water level, stream erosion, changes in ground water, earthquakes, volcanic activity, disturbance by human activities, or any combination of these factors. Earthquake shaking and other factors can also induce landslides underwater. These landslides are called submarine landslides. Submarine landslides sometimes cause tsunamis that damage coastal areas.
Read more: Landslide-triggered tsunamis becoming more common
Bottom line: A new map from the USGS shows what areas of the United States are susceptible to landslides. See the map and read more about landslides.
Source: Parsimonious High-Resolution Landslide Susceptibility Modeling at Continental Scales
Via USGS
Author: Space and Astronomy News
Maybe later


No comments! Be the first commenter?