*
Solar wind is a never-ending stream of charged particles coming from the Sun. Rather than a constant breeze, this wind is rather gusty. As solar wind particles travel through space, they interact with the Sun’s variable magnetic field, creating chaotic and fluctuating motion known as turbulence.
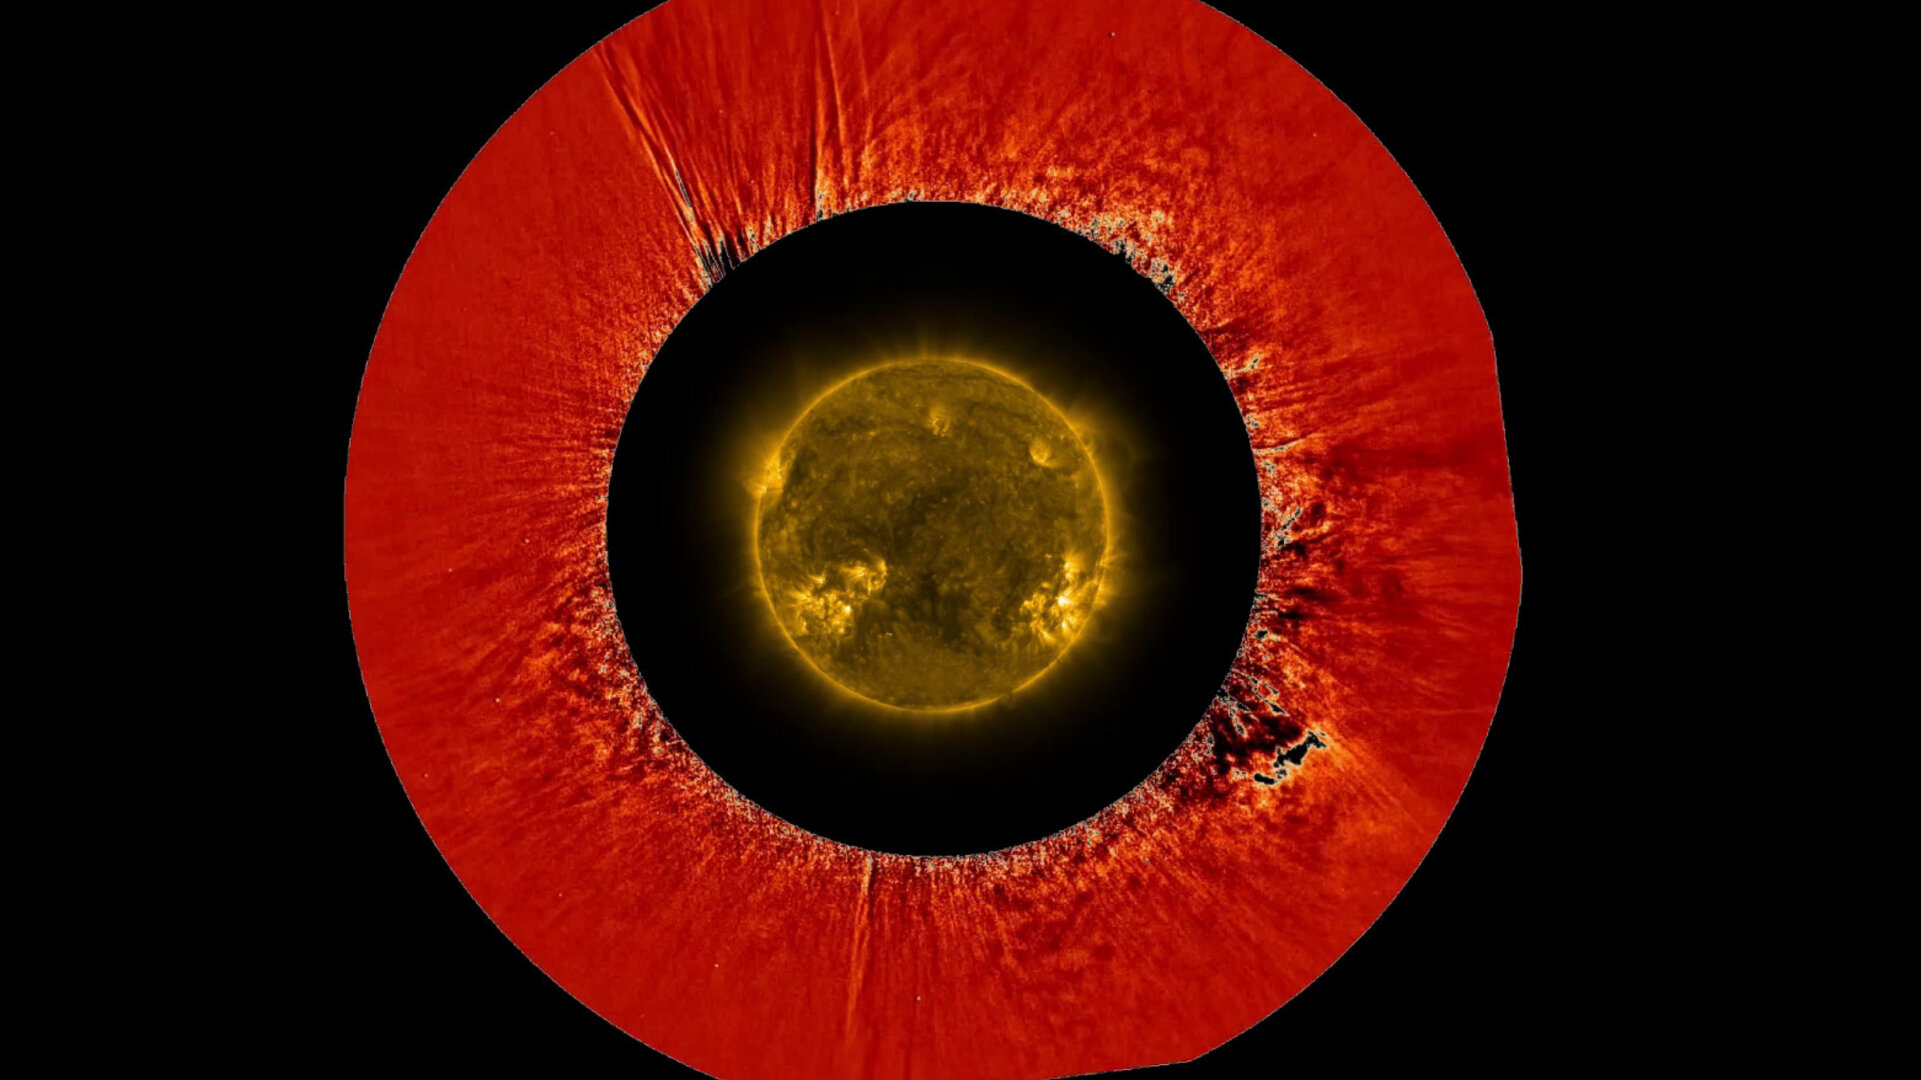
This video confirms something long suspected: the turbulent motion of solar wind begins very close to the Sun, inside the solar atmosphere known as the corona. Small disturbances affecting solar wind in the corona are carried outward and expand, generating turbulent flow further out in space.
By blocking out direct light coming from the Sun, the Metis coronagraph instrument on Solar Orbiter is able to capture the fainter visible and ultraviolet light coming from the solar corona. Its high-resolution images show the detailed structure and movement within the corona, revealing how solar wind motion already becomes turbulent at its roots.
The red-tinted ring in the video shows Metis observations made on 12 October 2022. At the time, the spacecraft was just 43.4 million km from the Sun, less than a third of the Sun–Earth distance. The video of the Sun in the centre of the video was recorded by Solar Orbiter’s Extreme Ultraviolet Imager (EUI) on the same day. (Read more about Solar Orbiter’s instruments here.)
“This new analysis provides the first-ever evidence for the onset of fully developed turbulence in the Sun’s corona. Solar Orbiter’s Metis coronagraph was able to detect it very close to the Sun, closer than any spacecraft could approach the Sun and make local measurements,” explains Daniel Müller, ESA’s Solar Orbiter Project Scientist.
Turbulence affects how solar wind is heated, how it moves through the Solar System and how it interacts with the magnetic fields of planets and moons it passes through. Understanding solar wind turbulence is crucial for predicting space weather and its effects on Earth.
‘Metis observation of the onset of fully developed turbulence in the solar corona’ by Daniele Telloni et al. was published today in Astrophysical Journal Letters.
[Video description: The Sun is shown in the centre, surrounded by a ring of data from Solar Orbiter’s Metis coronagraph. The data show changes in brightness of the solar corona, which directly relates to the density of charged particles. These changes are made visible by subtracting consecutive coronal brightness images taken two minutes apart. Red regions show no change, while white and black regions highlight positive and negative changes in brightness. This reveals how charged solar wind particles within the corona move in a chaotic, turbulent way. The video repeats three times.]


No comments! Be the first commenter?